6. Gunicorn
6.1. Why Gunicorn?
We now need to replace the Django development server with a Python application server. I will explain later why we need this. For now we need to select which Python application server to use. There are three popular servers: mod_wsgi, uWSGI, and Gunicorn.
mod_wsgi is for Apache only, and I prefer to use a method that can be used with either Apache or nginx. This will make it easier to change the web server, should such a need arise. I also find Gunicorn easier to setup and maintain.
I used uWSGI for a couple of years and was overwhelmed by its features. Many of them duplicate features that already exist in Apache or nginx or other parts of the stack, and thus they are rarely, if ever, needed. Its documentation is a bit chaotic. The developers themselves admit it: “We try to make our best to have good documentation but it is a hard work. Sorry for that.” I recall hitting problems week after week and spending hours to solve them each time.
Gunicorn, on the other hand, does exactly what you want and no more. It is simple and works fine. So I recommend it unless in your particular case there is a compelling reason to use one of the others, and so far I haven’t met any such compelling reason.
6.2. Installing and running Gunicorn
We will install Gunicorn with pip rather than with apt, because
the packaged Gunicorn (both in Debian 8 and Ubuntu 16.04) supports only
Python 2.
/opt/$DJANGO_PROJECT/venv/bin/pip install gunicorn
Now run Django with Gunicorn:
su $DJANGO_USER
source /opt/$DJANGO_PROJECT/venv/bin/activate
export PYTHONPATH=/etc/opt/$DJANGO_PROJECT:/opt/$DJANGO_PROJECT
export DJANGO_SETTINGS_MODULE=settings
gunicorn $DJANGO_PROJECT.wsgi:application
You can also write it as one long command, like this:
PYTHONPATH=/etc/opt/$DJANGO_PROJECT:/opt/$DJANGO_PROJECT \
    DJANGO_SETTINGS_MODULE=settings \
    su $DJANGO_USER -c "/opt/$DJANGO_PROJECT/venv/bin/gunicorn \
    $DJANGO_PROJECT.wsgi:application"
Either of the two versions above will start Gunicorn, which will be listening at port 8000, like the Django development server did. Visit http://$DOMAIN/, and you should see your Django project in action.
What actually happens here is that gunicorn, a Python program, does
something like from $DJANGO_PROJECT.wsgi import application. It uses
$DJANGO_PROJECT.wsgi and application because we told it so in
the command line. Open the file
/opt/$DJANGO_PROJECT/$DJANGO_PROJECT/wsgi.py to see that
application is defined there. In fact, application is a Python
callable. Now each time Gunicorn receives an HTTP request, it calls
application() in a standardized way that is specified by the WSGI
specification. The fact that the interface of this function is
standardized is what permits you to choose between many different Python
application servers such as Gunicorn, uWSGI, or mod_wsgi, and why each
of these can interact with many Python application frameworks like
Django or Flask.
The reason we aren’t using the Django development server is that it is meant for, well, development. It has some neat features for development, such as that it serves static files, and that it automatically restarts itself whenever the project files change. It is, however, totally inadequate for production; for example, it might leave files or connections open, and it does not support processing many requests at the same time, which you really want. Gunicorn, on the other hand, does the multi-processing part correctly, leaving to Django only the things that Django can do well.
Gunicorn is actually a web server, like Apache and nginx. However, it does only one thing and does it well: it runs Python WSGI-compliant applications. It cannot serve static files and there’s many other features Apache and nginx have that Gunicorn does not. This is why we put Apache or nginx in front of Gunicorn and proxy-pass requests to it. The accurate name for Gunicorn, uWSGI, and mod_wsgi would be “specialized web servers that run Python WSGI-compliant applications”, but this is too long, which is why I’ve been using the vaguer “Python application servers” instead.
Gunicorn has many parameters that can configure its behaviour. Most of them work fine with their default values. Still, we need to modify a few. Let’s run it again, but this time with a few parameters:
su $DJANGO_USER
source /opt/$DJANGO_PROJECT/venv/bin/activate
export PYTHONPATH=/etc/opt/$DJANGO_PROJECT:/opt/$DJANGO_PROJECT
export DJANGO_SETTINGS_MODULE=settings
gunicorn --workers=4 \
    --log-file=/var/log/$DJANGO_PROJECT/gunicorn.log \
    --bind=127.0.0.1:8000 --bind=[::1]:8000 \
    $DJANGO_PROJECT.wsgi:application
Here is what these parameters mean:
--workers=4Gunicorn starts a number of processes called “workers”, and each process, each worker that is, serves one request at a time. To serve five concurrent requests, five workers are needed; if there are more concurrent requests than workers, they will be queued. You probably need two to five workers per processor core. Four workers are a good starting point for a single-core machine. The reason you don’t want to increase this too much is that your Django project’s RAM consumption is approximately proportional to the number of workers, as each worker is effectively a distinct instance of the Django project. If you are short on RAM, you might want to consider decreasing the number of workers. If you get many concurrent requests and your CPU is underused (usually meaning your Django projects do a lot of disk/database access) and you can spare the RAM, you can increase the number of workers.
Tip
Check your CPU and RAM usage
If your server gets busy, the Linux
topcommand will show you useful information about the amount of free RAM, the RAM consumed by your Django project (and other system processes), and the CPU usage for various processes. You can read more about it in The top command: memory management and The top command: CPU usage.--log-file=/var/log/$DJANGO_PROJECT/gunicorn.log- I believe this is self-explanatory.
--bind=127.0.0.1:8000This tells Gunicorn to listen on port 8000 of the local network interface. This is the default, but we specify it here for two reasons:
- It’s such an important setting that you need to see it to know what you’ve done. Besides, you could be running many applications on the same server, and one could be listening on 8000, another on 8001, and so on. So, for uniformity, always specify this.
- We specify
--bindtwice (see below), to also listen on IPv6. The second time would override the default anyway.
--bind=[::1]:8000This tells Gunicorn to also listen on port 8000 of the local IPv6 network interface. This must be specified if IPv6 is enabled on the virtual server. It is not specified, things may or may not work, and the system may be a bit slower even if things work.
The reason is that the front-end web server, Apache or nginx, has been told to forward the requests to http://localhost:8000/. It will ask the the resolver what “localhost” means. If the system is IPv6-enabled, the resolver will reply with two results,
::1, which is the IPv6 address for the localhost, and127.0.0.1. The web server might then decide to try the IPv6 version first. If Gunicorn has not been configured to listen to that address, then nothing will be listening at port 8000 of ::1, so the connection will be refused. The web server will then probably try the IPv4 version, which will work, but it will have made a useless attempt first.I could make some experiments to determine exactly what happens in such cases, and not speak with “maybe” and “probably”, but it doesn’t matter. If your server has IPv6, you must set it up correctly and use this option. If not, you should not use this option.
6.3. Configuring systemd
The only thing that remains is to make Gunicorn start automatically. For this, we will configure it as a service in systemd.
Note
Older systems don’t have systemd
systemd is relatively a novelty. It exists only in Debian 8 and
later, and Ubuntu 15.04 and later. In older systems you need to
start Gunicorn in another way. I recommend supervisor, which you can
install with apt install supervisor.
The first program the kernel starts after it boots is systemd. For this
reason, the process id of systemd is 1. Enter the command ps 1 and
you will probably see that the process with id 1 is /sbin/init, but
if you look at it with ls -lh /sbin/init, you will see it’s a
symbolic link to systemd.
After systemd starts, it has many tasks, one of which is to start and
manage the system services. We will tell it that Gunicorn is one of
these services by creating file
/etc/systemd/system/$DJANGO_PROJECT.service, with the following
contents:
[Unit]
Description=$DJANGO_PROJECT

[Service]
User=$DJANGO_USER
Group=$DJANGO_GROUP
Environment="PYTHONPATH=/etc/opt/$DJANGO_PROJECT:/opt/$DJANGO_PROJECT"
Environment="DJANGO_SETTINGS_MODULE=settings"
ExecStart=/opt/$DJANGO_PROJECT/venv/bin/gunicorn \
    --workers=4 \
    --log-file=/var/log/$DJANGO_PROJECT/gunicorn.log \
    --bind=127.0.0.1:8000 --bind=[::1]:8000 \
    $DJANGO_PROJECT.wsgi:application

[Install]
WantedBy=multi-user.target
After creating that file, if you enter service $DJANGO_PROJECT
start, it will start Gunicorn. However, it will not start it
automatically at boot until we tell it systemctl enable
$DJANGO_PROJECT.
The [Service] section of the configuration file should be
self-explanatory, so I will only explain the other two sections. Systemd
doesn’t only manage services; it also manages devices, sockets, swap
space, and other stuff. All these are called units; “unit” is, so to
speak, the superclass. The [Unit] section contains configuration
that is common to all unit types. The only option we need to specify
there is Description, which is free text. Its purpose is only to
show in the UI of management tools. Although $DJANGO_PROJECT will work
as a description, it’s better to use something more verbose. As the
systemd documentation says,
“Apache2 Web Server” is a good example. Bad examples are “high-performance light-weight HTTP server” (too generic) or “Apache2” (too specific and meaningless for people who do not know Apache).
The [Install] section tells systemd what to do when the service is
enabled. The WantedBy option specifies dependencies. If, for
example, we wanted to start Gunicorn before nginx, we would specify
WantedBy=nginx.service. This is too strict a dependency, so we just
specify WantedBy=multi-user.target. A target is a unit type that
represents a state of the system. The multi-user target is a state all
GNU/Linux systems reach in normal operations. Desktop systems go beyond
that to the “graphical” target, which “wants” a multi-user system and
adds a graphical login screen to it; but we want Gunicorn to start
regardless whether we have a graphical login screen (we probably don’t,
as it is a waste of resources on a server).
As I already said, you tell systemd to automatically start the service at boot (and automatically stop it at system shutdown) in this way:
systemctl enable
$DJANGO_PROJECT
Do you remember that in nginx and Apache you enable a site just by
creating a symbolic link to sites-available from sites-enabled?
Likewise, systemctl enable does nothing but create a symbolic link.
The dependencies we have specified in the [Install] section of the
configuration file determine where the symbolic link will be created
(sometimes more than one symbolic links are created). After you enable
the service, try to restart the server, and check that your Django
project has started automatically.
As you may have guessed, you can disable the service like this:
systemctl disable $DJANGO_PROJECT
This does not make use of the information in the [Install] section;
it just removes all symbolic links.
6.4. More about systemd
While I don’t want to bother you with history, if you don’t read this section you will eventually get confused by the many ways you can manage a service. For example, if you want to tell nginx to reload its configuration, you can do it with either of these commands:
systemctl reload nginx
service nginx reload
/etc/init.d/nginx reload
Before systemd, the first program that was started by the kernel was
init. This was much less smart than systemd and did not know what a
“service” is. All init could do was execute programs or scripts. So
if we wanted to start a service we would write a script that started the
service and put it in /etc/init.d, and enable it by linking it from
/etc/rc2.d. When init brought the system to “runlevel 2”, the
equivalent of systemd’s multi-user target, it would execute the scripts
in /etc/rc2.d. Actually it wasn’t init itself that did that, but
other programs that init was configured to run, but this doesn’t
matter. What matters is that the way you would start, stop, or restart
nginx, or tell it to reload its configuration, or check its running
status, was this:
/etc/init.d/nginx start
/etc/init.d/nginx stop
/etc/init.d/nginx restart
/etc/init.d/nginx reload
/etc/init.d/nginx status
The problem with these commands was that they might not always work
correctly, mostly because of environment variables that might have been
set, so the service script was introduced around 2005, which, as its
documentation says, runs an init script “in as predictable an
environment as possible, removing most environment variables and with
the current working directory set to /.” So a better alternative for the
above commands was
service nginx start
service nginx stop
service nginx restart
service nginx reload
service nginx status
The new way of doing these with systemd is the following:
systemctl start nginx
systemctl stop nginx
systemctl restart nginx
systemctl reload nginx
systemctl status nginx
Both systemctl and service will work the same with your Gunicorn
service, because service is a backwards compatible way to run
systemctl. You can’t manage your service with an /etc/init.d
script, because we haven’t created any such script (and it would have
been very tedious to do so, which is why we preferred to use supervisor
before we had systemd). For nginx and Apache, all three ways are
available, because most services packaged with the operating system are
still managed with init scripts, and systemd has a backwards compatible
way of dealing with such scripts. In future versions of Debian and
Ubuntu, it is likely that the init scripts will be replaced with systemd
configuration files like the one we wrote for Gunicorn, so the
/etc/init.d way will cease to exist.
Of the remaining two newer ways, I don’t know which is better.
service has the benefit that it exists in non-Linux Unix systems,
such as FreeBSD, so if you use both GNU/Linux and FreeBSD you can use
the same command in both. The systemctl version may be more
consistent with other systemd commands, like the ones for enabling and
disabling services. Use whichever you like.
6.5. The top command: memory management
If your server gets busy and you wonder whether its RAM and CPU are
enough, the Linux top command is a useful tool. Execute it simply by
entering top. You can exit top by pressing q on the
keyboard.
When you execute top you will see an image similar to Fig. 6.1.
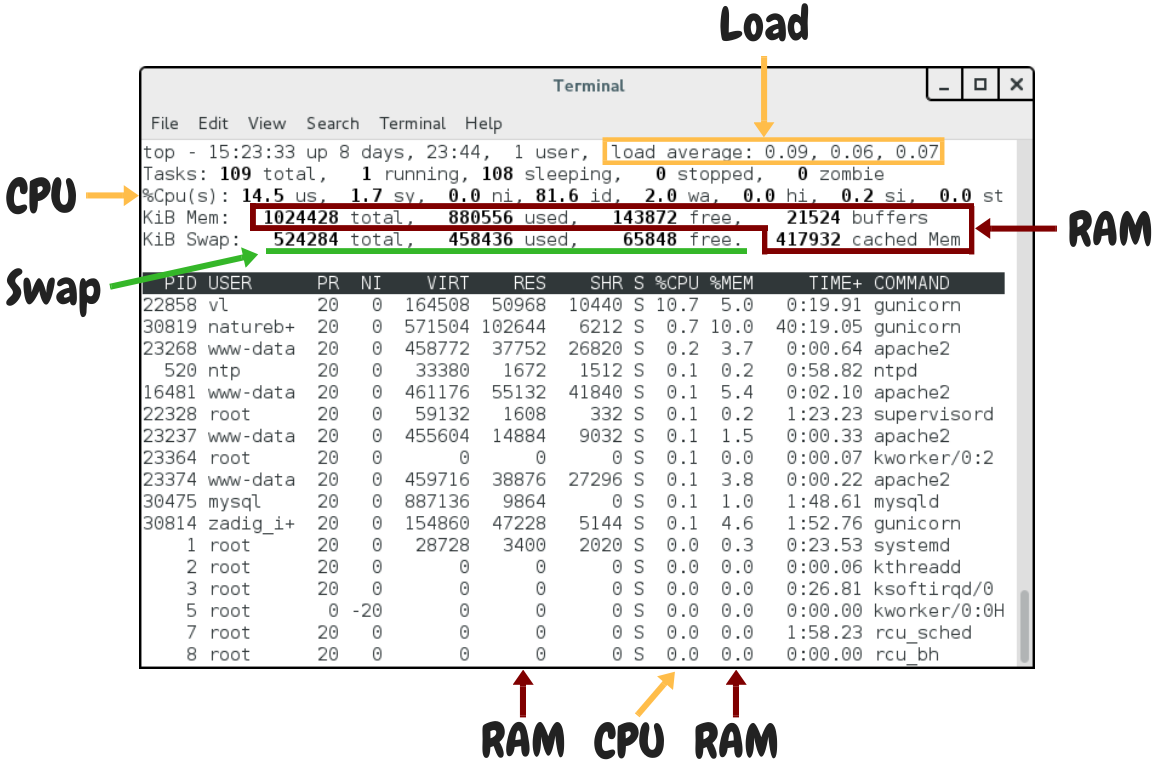
Fig. 6.1 The top command
Let’s examine available RAM first, which in Fig. 6.1 is
indicated in the red box. The output of top is designed so that it
fits in an 80-character wide terminal. For the RAM, the five values
(total, used, free, buffers, and cached) can’t fit on the line that is
labeled “KiB Mem”, so the last one has been moved to the line below,
that is, the “cached Mem” indication belongs in “KiB Mem” and not in
“KiB Swap”.
The “total” amount of RAM is simply the total amount of RAM; it is as much as you asked your virtual server to have. The “used” plus the “free” equals the total. Linux does heavy caching, which I explain below, so the “used” should be close to the total, and the “free” should be close to zero.
Since RAM is much faster than the disk, Linux caches information from the disk in RAM. It does so in a variety of ways:
- If you open a file, read it, close it, then you open it again and read it again, the second time it will be much faster; this is because Linux has cached the contents of the file in RAM.
- Whenever you write a file, you are likely to read it again, so Linux caches it.
- In order to speed up disk writing, Linux doesn’t actually write to the
disk when your program says
f.write(data), not even when you close the file, not even when your program ends. It keeps the data in the cache and writes it later, attempting to optimize disk head movement. This is why some data may be lost when the system is powered off instead of properly shut down.
The part of RAM that is used for Linux’s disk cache is what top
shows as “buffers” and “cached”. Buffers is also a kind of cache, so it
is the sum of “buffers” and “cache” that matters (the difference between
“buffers” and “cached” doesn’t really matter unless you are a kernel
developer). “Buffers” is usually negligible, so it’s enough to only
look at “cache”.
Linux doesn’t want your RAM sitting down doing nothing, so if there is RAM available, it will use it for caching. Give it more RAM and it will cache more. If your server has a substantial amount of RAM labeled “free”, it may mean that you have so much RAM that Linux can’t fill it in even with its disk cache. This probably means the machine is larger than it needs to be, so it’s a waste of resources. If, on the other hand, the cache is very small, this may mean that the system is short on RAM. On a healthy system, the cache should be 20–50% of RAM.
Since we are talking about RAM, let’s also examine the amount of RAM
used by processes. By default top sorts processes by CPU usage,
but you can type M (Shift + m) to sort by memory usage (you can
go back to sort by CPU usage by typing P). The RAM used by each
process is indicated by the “RES” column in KiB and the “%MEM” column in
percentage.
There are two related columns; “VIRT”, for virtual memory, and “SHR”, for shared memory. First of all, you need to forget the Microsoft terminology. Windows calls “virtual memory” what everyone else calls “swap space”; and what everyone else calls “virtual memory” is a very different thing from swap space. In order to better understand what virtual memory is, let’s see it with this C program (it doesn’t matter if you don’t speak C):
#include <stdio.h>
#include <stdlib.h>
#include <errno.h>
#include <string.h>

int main() {
    char c;
    void *p;

    /* Allocate 2 GB of memory */
    p = malloc(2L * 1024 * 1024 * 1024);
    if (!p) {
        fprintf(stderr, "Can't allocate memory: %s\n",
                strerror(errno));
        exit(1);
    }

    /* Do nothing until the user presses Enter */
    fputs("Press Enter to continue...", stderr);
    while((c = fgetc(stdin)) != EOF && c != '\n')
        ;

    /* Free memory and exit */
    free(p);
    exit(0);
}
When I run this program on my laptop, and while it is waiting for me to
press Enter, this is what top shows about it:
. PID ...    VIRT    RES    SHR S  %CPU %MEM ... COMMAND
13687 ... 2101236    688    612 S   0.0  0.0 ... virtdemo
It indicates 2 GB VIRT, but actually uses less than 1 MB of RAM, while
swap usage is still at zero. Overall, running the program has had a
negligible effect on the system. The reason is that the malloc
function has only allocated virtual memory; “virtual” as in “not real”.
The operating system has provided 2 GB of virtual address space to the
program, but the program has not used any of that. If the program had
used some of this virtual memory (i.e. if it had written to it), the
operating system would have automatically allocated some RAM and would
have mapped the used virtual address space to the real address space in
the RAM.
So virtual memory is neither swap nor swap plus RAM; it’s virtual. The
operating system maps only the used part of the process’s virtual memory
space to something real; usually RAM, sometimes swap. Many programs
allocate much more virtual memory than they actually use. For this
reason, the VIRT column of top is not really useful. The RES
column, that stands for “resident”, indicates the part of RAM actually
used.
The SHR column indicates how much memory the program potentially shares
with other processes. Usually all of that memory is included in the RES
column. For example, in Fig. 6.1, there are four apache2
processes which I show again here:
. PID ...    VIRT    RES    SHR S  %CPU %MEM ... COMMAND
23268 ...  458772  37752  26820 S   0.2  3.7 ... apache2
16481 ...  461176  55132  41840 S   0.1  5.4 ... apache2
23237 ...  455604  14884   9032 S   0.1  1.5 ... apache2
23374 ...  459716  38876  27296 S   0.1  3.8 ... apache2
It is unlikely that the total amount of RAM used by these four processes is the sum of the RES column (about 140 MB); it is more likely that something like 9 MB is shared among all of them, which would bring the total to about 110 MB. Maybe even less. They might also be sharing something (such as system libraries) with non-apache processes. It is not really possible to know how much of the memory marked as shared is actually being shared, and by how many processes, but it is something you need to take into account in order to explain why the total memory usage on your system is less than the sum of the resident memory for all processes.
Let’s now talk about swap. Swap is disk space used for temporarily writing (swapping) RAM. Linux uses it in two cases. The first one is if a program has actually used some RAM but has left it unused for a long time. If a process has written something to RAM but has not read it back for several hours, it means the RAM is being wasted. Linux doesn’t like that, so it may save that part of RAM to the disk (to the swap space), which will free up the RAM for something more useful (such as caching). This is the case in Fig. 6.1. The system is far from low on memory, and yet it has used a considerable amount of swap space. The only explanation is that some processes have had unused data in RAM for too long. When one of these processes eventually attempts to use swapped memory, the operating system will move it from the swap space back to the RAM (if there’s not enough free RAM, it will swap something else or discard some of its cache).
The second case in which Linux will use swap is if it’s low on memory.
This is a bad thing to happen and will greatly slow down the system,
sometimes to a grinding halt. You can understand that this is the case
from the fact that swap usage will be considerable while at the same
time the free and cached RAM will be very low. Sometimes you will be
unable to even run top when this happens.
Whereas in Windows the swap space (confusingly called “virtual memory”)
is a file, on Linux it is usually a disk partition. You can find out
where swap is stored on your system by examining the contents of file
/proc/swaps, for example by executing cat /proc/swaps. (The
“files” inside the /proc directory aren’t real; they are created by
the kernel and they do not exist on the disk. cat prints the
contents of files, similar to less, but does not paginate.)
6.6. The top command: CPU usage
The third line of top has eight numbers which add up to 100%. They
are user, system, nice, idle, waiting, hardware interrupts, software
interrupts, and steal, and indicate where the CPU spent its time in the
last three seconds:
- us (user) and sy (system) indicate how much of its time the processor was running programs in user mode and in kernel mode. Most code runs in user mode; but when a process asks the Linux kernel to do something (allocate memory, access the disk, network, or other device, start another process, etc.), the kernel switches to kernel mode, which means it has some priviliges that user mode doesn’t have. (For example, kernel mode has access to all RAM and can modify the mapping between the processes’ virtual memory and RAM/swap; whereas user mode simply has access to the virtual address space and doesn’t know what happens behind the scenes.)
- ni (nice) indicates how much of its time the processor was running with a positive “niceness” value. If many processes need the CPU at the same time, a “nice” process has lower priority. The “niceness” is a number up to 19. A process with a “niceness” of 19 will practically only run when the CPU would otherwise be idle. For example, the GNOME desktop environment’s Desktop Search finds stuff in your files, and it does so very fast because it uses indexes. These indexes are updated in the background by the “tracker” process, which runs with a “niceness” of 19 in order to not make the rest of the system slower. Processes may also run with a negative niceness (up to -20), which means they have higher priority. In the list of processes, the NI column indicates the “niceness”. Most processes have the default zero niceness, and it is unlikely you will ever need to know more about all that.
- id (idle) and wa (waiting) indicate how much time the CPU was sitting down doing nothing. “Waiting” is a special case of idle; it means that while the CPU was idle there was at least one process waiting for disk I/O. A high value of “waiting” indicates heavy disk usage.
- The meaning of time spent in hi (hardware interrupts) and si (software interrupts) is very technical. If this is non-negligible, it indicates heavy I/O (such as disk or network).
- st (steal) is for virtual machines. When nonzero, it indicates that for that amount of time the virtual machine needed to run something on the (virtual) CPU, but it had to wait because the real CPU was unavailable, either because it was doing something else (e.g. servicing another virtual machine on the same host) or because of reaching the CPU usage quota.
If the machine has more than one CPUs or cores, the “%Cpu(s)” line of
top shows data collectively for all CPUs; but you can press 1 to
toggle between that and showing information for each individual CPU.
In the processes list, the %CPU column indicates the amount of time the CPU was working for that process, either in user mode or in kernel mode (when kernel code is running, most of the time it is in order to service a process, so this time is accounted for in the process). The %CPU column can add up to more than 100% if you have more than one cores; for four cores it can add up to 400% and so on.
Finally, let’s discuss about the CPU load. When your system is doing nothing, the CPU load is zero. If there is one process using the CPU, the load is one. If there is one process using the CPU and another process that wants to run and is queued for the CPU to become available, the load is two. The three numbers in the orange box in Fig. 6.1 are the load average in the last one, five, and 15 minutes. The load average should generally be less than the number of CPU cores, and preferably under 0.7 times the number of cores. It’s OK if it spikes sometimes, so the load average for the last minute can occasionally go over the number of cores, but the 5- or 15-minute average should stay low. For more information about the load average, there’s an excellent blog post by Andre Lewis, Understanding Linux CPU Load - when should you be worried?
6.7. Chapter summary
Install
gunicornin your virtualenv.Create file
/etc/systemd/system/$DJANGO_PROJECT.servicewith these contents:[Unit] Description=$DJANGO_PROJECT [Service] User=$DJANGO_USER Group=$DJANGO_GROUP Environment="PYTHONPATH=/etc/opt/$DJANGO_PROJECT:/opt/$DJANGO_PROJECT" Environment="DJANGO_SETTINGS_MODULE=settings" ExecStart=/opt/$DJANGO_PROJECT/venv/bin/gunicorn \ --workers=4 \ --log-file=/var/log/$DJANGO_PROJECT/gunicorn.log \ --bind=127.0.0.1:8000 --bind=[::1]:8000 \ $DJANGO_PROJECT.wsgi:application [Install] WantedBy=multi-user.target
Enable the service with
systemctl enable $DJANGO_PROJECT, and start/stop/restart it or get its status withsystemctl $COMMAND $DJANGO_PROJECT, where $COMMAND is start, stop, restart or status.